Polar TEP dashboards allow a wide variety of curated datasets to be visualized and analyzed at different times and regions of interest.
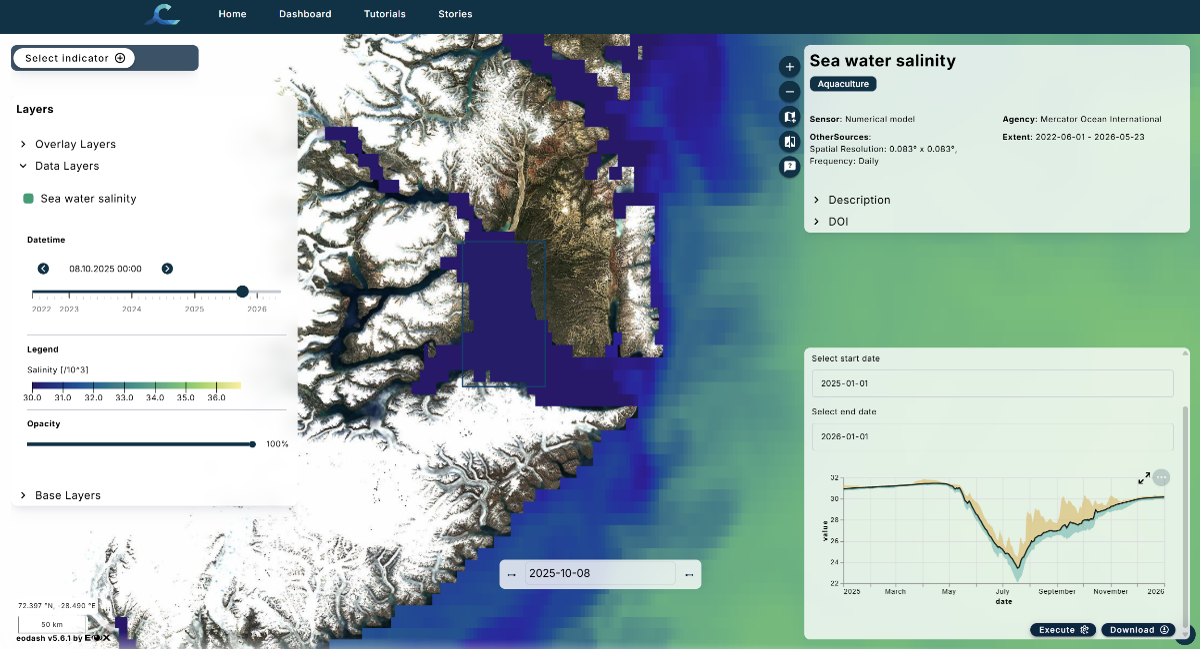
Show customized charts to visualize your results
Define and execute data processing workflows with ease using a structured and powerful configuration.
Integrate all your data sources
Seamlessly connect to various data sources and APIs, bringing all your earth observation data into one place.
A dashboard can also act as a user interface for on-demand processing of algorithms.
Client-Side Rendering
Provides powerful support for direct rendering of raster and vector data on the client-side. This allows for highly interactive visualizations of cloud-optimized data formats.
Key capabilities include:
- Dynamic Styling: Specify styles for your data and update them dynamically based on user input, for example through a form.
- High Performance: Optimized for performance, ensuring smooth rendering and a great user experience even with large datasets.
Customizable Themes
Allow the appearance of a dashboard to be tailored to match branding and design preferences.
Key features:
- Theme Definitions: Easily define and switch between themes.
- Predefined Themes: A set of predefined themes is available to get you started quickly.
- Deep Customization: Control colors, fonts, layout, and more to create a unique user experience.
Endpoint Integration
Supported endpoint types include:
- WMS (Web Map Service)
- XYZ tiles
- Vector tiles
- And many more...
This flexibility allows data to be brought from various sources to create rich, composite applications.
Integrate APIs
Define processes that allow calling a large set of API endpoints. This enables complex workflows and interactions with backend services.
Key capabilities include:
- JSON Forms: Utilize JSON Form definitions for handling user input, making it easy to create intuitive user interfaces for complex processes.
- Flexible Output: Define how to visualize the results of a process. You can use an OpenLayers flat style to display results on a map, or a Vega chart definition to create custom charts and graphs.
Web Component
A web component allows for easy integration into virtually any web framework.
Key advantages include:
- Framework Agnostic: Use eodash with React, Angular, Vue, or any other modern web framework.
- Encapsulation: The web component encapsulates all of its HTML, CSS, and JavaScript, preventing conflicts with the surrounding application.
- Easy to Use: Simply add the eodash web component to your page to embed a full-featured dashboard.
Widget-based Extensibility
Key benefits:
- Custom Widgets: Develop your own widgets to add new features and capabilities.
- Easy Integration: Seamlessly integrate your custom widgets into the eodash dashboard.
- Reusable Components: Create reusable components that can be shared and used across different eodash instances.